The VIKOR technique was first introduced by Opricovic in 1998 in order to solve multi-criteria decision making (MCDM) problems and obtain the best compromise solution. This method focuses on ranking and selecting from a set of alternatives in the presence of conflicting criteria. The main objective of the VIKOR method is to choose a solution that is closest to the ideal level in each criterion such that the alternatives are based on the particular measure of ‘‘closeness’’ to the ‘‘ideal’’ solution.
In this study there are 3 criteria and 5 alternatives that are ranked based on VIKOR method. The table below shows the type of criterion and weight assigned to each criterion.
Characteristics of Criteria
| name | type | weight | |
| 1 | Tax Rev | Positive | 0.35218891 |
| 2 | Soc | Positive | 0.559065046 |
| 3 | Econ | Negative | 0.088746044 |
The following table shows the decision matrix.
Decision Matrix
| Tax Rev | Soc | Econ | |
| Benchmark | 244326.5 | 1.030538 | 0 |
| Rovna Dan | 495071.16 | 1.020066 | 0 |
| Robin Hood | 337114.12 | 1.052836 | 1 |
| Middle Class | 323884.5 | 1.022462 | 0 |
| Low class | 322725.54 | 1.006767 | 0 |
The VIKOR method involves the following steps:
The Steps of the VIKOR Method
STEP 1: Normalize the decision matrix
The following formula can be used to normalize.
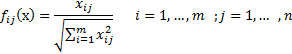
The table below shows the normalized decision matrix.
Normalized Decision Matrix
| Tax Rev | Soc | Econ | |
| Benchmark | 0.308 | 0.449 | 0 |
| Rovna Dan | 0.625 | 0.444 | 0 |
| Robin Hood | 0.426 | 0.459 | 1 |
| Middle Class | 0.409 | 0.445 | 0 |
| Low class | 0.407 | 0.439 | 0 |
STEP 2: Determine the best
![]() and worst
and worst
![]() benefits of each criterion
benefits of each criterion
The best and worse benefits can be determined by the following formula:
If the criterion is positive, then
![]()
If the criterion is negative, then
![]()
The positive ideal solution (
![]() and negative ideal solution (
and negative ideal solution (
![]() can be expressed as follows:
can be expressed as follows:
![]()
![]()
STEP 3: Calculate the
![]() and
and
![]() values
values
The values
![]() and
and
![]() , representing the group utility and individual regret, respectively, can
be calculated by the formulas below :
, representing the group utility and individual regret, respectively, can
be calculated by the formulas below :
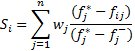
![]()
Where
![]() denotes the weight of the criteria.
denotes the weight of the criteria.
The following table shows the values
![]() and
and
![]() .
.
The values
![]() and
and
![]()
| R | S | |
| Benchmark | 0.352 | 0.623 |
| Rovna Dan | 0.398 | 0.398 |
| Robin Hood | 0.222 | 0.311 |
| Middle Class | 0.369 | 0.609 |
| Low class | 0.559 | 0.801 |
STEP4:
Calculate the value
![]()
The value
![]() , representing the VIKOR index for each alternative can be calculated by
the following formula:
, representing the VIKOR index for each alternative can be calculated by
the following formula:
![]()
Where
![]()
And
![]() is the maximum group utility represented by value 0.5.
is the maximum group utility represented by value 0.5.
The values
![]()
| Q | |
| Benchmark | 0.511 |
| Rovna Dan | 0.349 |
| Robin Hood | 0 |
| Middle Class | 0.522 |
| Low class | 1 |
STEP5: Rank the alternatives, sorting by the S, R and Q values
Alternatives are ranked by sorting the S, R, and Q, values in decreasing order such that the best rank is assigned to the alternative with the smallest VIKOR value. The results are three ranking lists.
The following table presents the ranking list for the alternatives based on the S, R, and Q values
The ranking list for the alternatives
| R value | Rank in R | S value | Rank in S | Q value | Rank in Q | |
| Benchmark | 0.352 | 2 | 0.623 | 4 | 0.511 | 3 |
| Rovna Dan | 0.398 | 4 | 0.398 | 2 | 0.349 | 2 |
| Robin Hood | 0.222 | 1 | 0.311 | 1 | 0 | 1 |
| Middle Class | 0.369 | 3 | 0.609 | 3 | 0.522 | 4 |
| Low class | 0.559 | 5 | 0.801 | 5 | 1 | 5 |
STEP 6: Propose a compromise solution
the alternative (
![]() ), which is the best ranked by the measure Q (minimum) if the following two
conditions are satisfied:
), which is the best ranked by the measure Q (minimum) if the following two
conditions are satisfied:
Condition 1
. Acceptable advantage:
![]() where
where
![]() is the alternative with first position and
is the alternative with first position and
![]() is the alternative with second position in the ranking list by Q. m is
number of alternatives.
is the alternative with second position in the ranking list by Q. m is
number of alternatives.
Condition 2
. Acceptable stability in decision making: The alternative
![]() must also be the best ranked by S or/and R.
must also be the best ranked by S or/and R.
If one of the conditions is not satisfied, then a set of compromise solutions is proposed, which consists of:
Solution 1.
Alternatives
![]() if Condition 1 is not satisfied; Alternative
if Condition 1 is not satisfied; Alternative
![]() is determined by
is determined by
![]() for maximum M (the positions of these alternatives are ‘‘in closeness’’).
for maximum M (the positions of these alternatives are ‘‘in closeness’’).
Solution 2.
Alternatives
![]() and
and
![]() if only condition 2 is not satisfied.
if only condition 2 is not satisfied.
Solution 3. Alternative with the minimum Q value will be selected as the best Alternative if both conditions are satisfied.
result of the conditions survey is shown in the following table.
result of the conditions survey
|
Acceptance |
Condition 1 |
|
Acceptance |
Condition 2 |
|
Solution 3 |
Selected solution |
Therefore, Robin Hood is selected as the final alternative.