Fuzzy TOPSIS proposed by Hwang and Yoon in 1981 is a popular and widely used method for multi-criteria decision making (MCDM) used to rank the alternative in a fuzzy environment.
The Steps of the Fuzzy TOPSIS Method :
Step 1: Create a decision matrix
In this study there are 10 criteria and 10 alternatives that are ranked based on FUZZY TOPSIS method. The table below shows the type of criterion and weight assigned to each criterion.
Characteristics of Criteria
| name | type | weight | |
| 1 | Educational\n Institutions | Positive | (0.100,0.100,0.200) |
| 2 | Cost of Living | Positive | (0.100,0.100,0.100) |
| 3 | Student-Friendly Environment | Negative | (0.050,0.050,0.100) |
| 4 | Job Opportunities | Negative | (0.050,0.050,0.050) |
| 5 | Safety | Positive | (0.050,0.050,0.050) |
| 6 | Cultural and Social Life | Positive | (0.100,0.100,0.100) |
| 7 | Climate | Negative | (0.100,0.100,0.200) |
| 8 | Transportation | Negative | (0.100,0.100,0.100) |
| 9 | Diversity and Inclusivity | Positive | (0.100,0.100,0.100) |
| 10 | Healthcare Facilities | Positive | (0.100,0.100,0.100) |
The following table shows the fuzzy scale used in the model.
Fuzzy Scale
| Code | Linguistic terms | L | M | U |
| 1 | Very low | 1 | 1 | 3 |
| 2 | Low | 1 | 3 | 5 |
| 3 | Medium | 3 | 5 | 7 |
| 4 | High | 5 | 7 | 9 |
| 5 | Very high | 7 | 9 | 9 |
The alternatives in terms of various criteria are evaluated and the results of the decision matrix are shown as follows. Note that if multiple experts participate in the evaluation, then the matrix below represents the arithmetic mean of all experts.
Decision Matrix
| Educational\n Institutions | Cost of Living | Student-Friendly Environment | Job Opportunities | Safety | Cultural and Social Life | Climate | Transportation | Diversity and Inclusivity | Healthcare Facilities | |
| Toronto\n - Canada | (2.000,3.000,5.000) | (1.000,3.000,5.000) | (1.000,3.000,5.000) | (3.000,4.000,6.000) | (1.000,1.000,3.000) | (1.000,2.000,4.000) | (2.000,3.000,5.000) | (3.000,5.000,7.000) | (6.000,8.000,9.000) | (3.000,4.000,6.000) |
| Melbourne - Australia | (2.000,3.000,5.000) | (4.000,5.000,6.000) | (4.000,5.000,6.000) | (1.000,3.000,5.000) | (4.000,5.000,6.000) | (3.000,5.000,7.000) | (3.000,4.000,6.000) | (2.000,3.000,5.000) | (2.000,3.000,5.000) | (2.000,4.000,6.000) |
| Berlin - Germany | (4.000,5.000,6.000) | (3.000,5.000,7.000) | (5.000,7.000,9.000) | (5.000,7.000,8.000) | (3.000,5.000,7.000) | (2.000,3.000,5.000) | (4.000,6.000,7.000) | (2.000,3.000,5.000) | (5.000,7.000,8.000) | (4.000,6.000,8.000) |
| Montreal - Canada | (4.000,6.000,7.000) | (1.000,3.000,5.000) | (6.000,8.000,9.000) | (4.000,5.000,6.000) | (3.000,5.000,7.000) | (1.000,3.000,5.000) | (1.000,2.000,4.000) | (3.000,5.000,7.000) | (3.000,5.000,7.000) | (1.000,1.000,3.000) |
| Amsterda - Netherlands | (3.000,4.000,6.000) | (4.000,6.000,7.000) | (3.000,5.000,7.000) | (3.000,5.000,7.000) | (2.000,4.000,6.000) | (1.000,3.000,5.000) | (5.000,7.000,8.000) | (1.000,3.000,5.000) | (6.000,8.000,9.000) | (3.000,5.000,7.000) |
| Dubli - Ireland | (3.000,4.000,6.000) | (3.000,5.000,7.000) | (2.000,3.000,5.000) | (4.000,6.000,7.000) | (1.000,2.000,4.000) | (3.000,5.000,7.000) | (3.000,5.000,7.000) | (4.000,6.000,7.000) | (4.000,6.000,7.000) | (6.000,8.000,9.000) |
| Barcelon - Spain | (6.000,8.000,9.000) | (4.000,6.000,7.000) | (4.000,5.000,6.000) | (1.000,1.000,3.000) | (3.000,4.000,6.000) | (3.000,4.000,6.000) | (4.000,6.000,8.000) | (3.000,4.000,6.000) | (5.000,7.000,9.000) | (3.000,4.000,6.000) |
| Vancouver - Canada | (4.000,5.000,6.000) | (2.000,4.000,6.000) | (4.000,6.000,8.000) | (1.000,2.000,4.000) | (2.000,4.000,6.000) | (1.000,3.000,5.000) | (6.000,8.000,9.000) | (2.000,4.000,6.000) | (5.000,7.000,8.000) | (6.000,8.000,9.000) |
| Edinburgh - United Kingdom | (4.000,6.000,7.000) | (2.000,3.000,5.000) | (4.000,6.000,7.000) | (6.000,8.000,9.000) | (2.000,3.000,5.000) | (2.000,3.000,5.000) | (3.000,5.000,7.000) | (5.000,7.000,9.000) | (1.000,1.000,3.000) | (3.000,5.000,7.000) |
| Singapore | (6.000,8.000,9.000) | (2.000,4.000,6.000) | (3.000,4.000,6.000) | (3.000,5.000,7.000) | (2.000,4.000,6.000) | (3.000,5.000,7.000) | (4.000,6.000,8.000) | (2.000,4.000,6.000) | (4.000,6.000,8.000) | (1.000,3.000,5.000) |
Step 2: Create the normalized decision matrix
Based on the positive and negative ideal solutions, a normalized decision matrix can be calculated by the following relation:
![]() ;
;
![]() ;
Positive ideal solution
;
Positive ideal solution
![]() ;
;
![]() ;
Negative ideal solution
;
Negative ideal solution
The normalized decision matrix is shown in the table below.
A normalized decision matrix
| Educational\n Institutions | Cost of Living | Student-Friendly Environment | Job Opportunities | Safety | Cultural and Social Life | Climate | Transportation | Diversity and Inclusivity | Healthcare Facilities | |
| Toronto\n - Canada | (0.222,0.333,0.556) | (0.143,0.429,0.714) | (0.200,0.333,1.000) | (0.167,0.250,0.333) | (0.143,0.143,0.429) | (0.143,0.286,0.571) | (0.200,0.333,0.500) | (0.143,0.200,0.333) | (0.667,0.889,1.000) | (0.333,0.444,0.667) |
| Melbourne - Australia | (0.222,0.333,0.556) | (0.571,0.714,0.857) | (0.167,0.200,0.250) | (0.200,0.333,1.000) | (0.571,0.714,0.857) | (0.429,0.714,1.000) | (0.167,0.250,0.333) | (0.200,0.333,0.500) | (0.222,0.333,0.556) | (0.222,0.444,0.667) |
| Berlin - Germany | (0.444,0.556,0.667) | (0.429,0.714,1.000) | (0.111,0.143,0.200) | (0.125,0.143,0.200) | (0.429,0.714,1.000) | (0.286,0.429,0.714) | (0.143,0.167,0.250) | (0.200,0.333,0.500) | (0.556,0.778,0.889) | (0.444,0.667,0.889) |
| Montreal - Canada | (0.444,0.667,0.778) | (0.143,0.429,0.714) | (0.111,0.125,0.167) | (0.167,0.200,0.250) | (0.429,0.714,1.000) | (0.143,0.429,0.714) | (0.250,0.500,1.000) | (0.143,0.200,0.333) | (0.333,0.556,0.778) | (0.111,0.111,0.333) |
| Amsterda - Netherlands | (0.333,0.444,0.667) | (0.571,0.857,1.000) | (0.143,0.200,0.333) | (0.143,0.200,0.333) | (0.286,0.571,0.857) | (0.143,0.429,0.714) | (0.125,0.143,0.200) | (0.200,0.333,1.000) | (0.667,0.889,1.000) | (0.333,0.556,0.778) |
| Dubli - Ireland | (0.333,0.444,0.667) | (0.429,0.714,1.000) | (0.200,0.333,0.500) | (0.143,0.167,0.250) | (0.143,0.286,0.571) | (0.429,0.714,1.000) | (0.143,0.200,0.333) | (0.143,0.167,0.250) | (0.444,0.667,0.778) | (0.667,0.889,1.000) |
| Barcelon - Spain | (0.667,0.889,1.000) | (0.571,0.857,1.000) | (0.167,0.200,0.250) | (0.333,1.000,1.000) | (0.429,0.571,0.857) | (0.429,0.571,0.857) | (0.125,0.167,0.250) | (0.167,0.250,0.333) | (0.556,0.778,1.000) | (0.333,0.444,0.667) |
| Vancouver - Canada | (0.444,0.556,0.667) | (0.286,0.571,0.857) | (0.125,0.167,0.250) | (0.250,0.500,1.000) | (0.286,0.571,0.857) | (0.143,0.429,0.714) | (0.111,0.125,0.167) | (0.167,0.250,0.500) | (0.556,0.778,0.889) | (0.667,0.889,1.000) |
| Edinburgh - United Kingdom | (0.444,0.667,0.778) | (0.286,0.429,0.714) | (0.143,0.167,0.250) | (0.111,0.125,0.167) | (0.286,0.429,0.714) | (0.286,0.429,0.714) | (0.143,0.200,0.333) | (0.111,0.143,0.200) | (0.111,0.111,0.333) | (0.333,0.556,0.778) |
| Singapore | (0.667,0.889,1.000) | (0.286,0.571,0.857) | (0.167,0.250,0.333) | (0.143,0.200,0.333) | (0.286,0.571,0.857) | (0.429,0.714,1.000) | (0.125,0.167,0.250) | (0.167,0.250,0.500) | (0.444,0.667,0.889) | (0.111,0.333,0.556) |
Step 3: Create the weighted normalized decision matrix
Considering the different weights of each criterion, the weighted normalized decision matrix can be calculated by multiplying the weight of each criterion in the normalized fuzzy decision matrix, according to the following formula.
![]()
Where
![]() represents weight of criterion
represents weight of criterion
![]()
The following table shows the weighted normalized decision matrix
The weighted normalized decision matrix
| Educational\n Institutions | Cost of Living | Student-Friendly Environment | Job Opportunities | Safety | Cultural and Social Life | Climate | Transportation | Diversity and Inclusivity | Healthcare Facilities | |
| Toronto\n - Canada | (0.022,0.033,0.111) | (0.014,0.043,0.071) | (0.010,0.017,0.100) | (0.008,0.013,0.017) | (0.007,0.007,0.021) | (0.014,0.029,0.057) | (0.020,0.033,0.100) | (0.014,0.020,0.033) | (0.067,0.089,0.100) | (0.033,0.044,0.067) |
| Melbourne - Australia | (0.022,0.033,0.111) | (0.057,0.071,0.086) | (0.008,0.010,0.025) | (0.010,0.017,0.050) | (0.029,0.036,0.043) | (0.043,0.071,0.100) | (0.017,0.025,0.067) | (0.020,0.033,0.050) | (0.022,0.033,0.056) | (0.022,0.044,0.067) |
| Berlin - Germany | (0.044,0.056,0.133) | (0.043,0.071,0.100) | (0.006,0.007,0.020) | (0.006,0.007,0.010) | (0.021,0.036,0.050) | (0.029,0.043,0.071) | (0.014,0.017,0.050) | (0.020,0.033,0.050) | (0.056,0.078,0.089) | (0.044,0.067,0.089) |
| Montreal - Canada | (0.044,0.067,0.156) | (0.014,0.043,0.071) | (0.006,0.006,0.017) | (0.008,0.010,0.013) | (0.021,0.036,0.050) | (0.014,0.043,0.071) | (0.025,0.050,0.200) | (0.014,0.020,0.033) | (0.033,0.056,0.078) | (0.011,0.011,0.033) |
| Amsterda - Netherlands | (0.033,0.044,0.133) | (0.057,0.086,0.100) | (0.007,0.010,0.033) | (0.007,0.010,0.017) | (0.014,0.029,0.043) | (0.014,0.043,0.071) | (0.013,0.014,0.040) | (0.020,0.033,0.100) | (0.067,0.089,0.100) | (0.033,0.056,0.078) |
| Dubli - Ireland | (0.033,0.044,0.133) | (0.043,0.071,0.100) | (0.010,0.017,0.050) | (0.007,0.008,0.013) | (0.007,0.014,0.029) | (0.043,0.071,0.100) | (0.014,0.020,0.067) | (0.014,0.017,0.025) | (0.044,0.067,0.078) | (0.067,0.089,0.100) |
| Barcelon - Spain | (0.067,0.089,0.200) | (0.057,0.086,0.100) | (0.008,0.010,0.025) | (0.017,0.050,0.050) | (0.021,0.029,0.043) | (0.043,0.057,0.086) | (0.013,0.017,0.050) | (0.017,0.025,0.033) | (0.056,0.078,0.100) | (0.033,0.044,0.067) |
| Vancouver - Canada | (0.044,0.056,0.133) | (0.029,0.057,0.086) | (0.006,0.008,0.025) | (0.013,0.025,0.050) | (0.014,0.029,0.043) | (0.014,0.043,0.071) | (0.011,0.013,0.033) | (0.017,0.025,0.050) | (0.056,0.078,0.089) | (0.067,0.089,0.100) |
| Edinburgh - United Kingdom | (0.044,0.067,0.156) | (0.029,0.043,0.071) | (0.007,0.008,0.025) | (0.006,0.006,0.008) | (0.014,0.021,0.036) | (0.029,0.043,0.071) | (0.014,0.020,0.067) | (0.011,0.014,0.020) | (0.011,0.011,0.033) | (0.033,0.056,0.078) |
| Singapore | (0.067,0.089,0.200) | (0.029,0.057,0.086) | (0.008,0.013,0.033) | (0.007,0.010,0.017) | (0.014,0.029,0.043) | (0.043,0.071,0.100) | (0.013,0.017,0.050) | (0.017,0.025,0.050) | (0.044,0.067,0.089) | (0.011,0.033,0.056) |
Step 4: Determine the
fuzzy positive ideal solution (FPIS, A*) and the fuzzy negative ideal
solution
(
![]() )
)
The FPIS and FNIS of the alternatives can be defined as follows:
![]()
![]()
Where
![]() is the max value of i for all the alternatives and
is the max value of i for all the alternatives and
![]() is the min value of i for all the alternatives. B and C
represent the positive and negative ideal solutions, respectively.
is the min value of i for all the alternatives. B and C
represent the positive and negative ideal solutions, respectively.
The positive and negative ideal solutions are shown in the table below.
The positive and negative ideal solutions
| Positive ideal | Negative ideal | |
| Educational\n Institutions | (0.067,0.089,0.200) | (0.022,0.033,0.111) |
| Cost of Living | (0.057,0.086,0.100) | (0.014,0.043,0.071) |
| Student-Friendly Environment | (0.006,0.006,0.017) | (0.010,0.017,0.100) |
| Job Opportunities | (0.006,0.006,0.008) | (0.017,0.050,0.050) |
| Safety | (0.029,0.036,0.050) | (0.007,0.007,0.021) |
| Cultural and Social Life | (0.043,0.071,0.100) | (0.014,0.029,0.057) |
| Climate | (0.011,0.013,0.033) | (0.025,0.050,0.200) |
| Transportation | (0.011,0.014,0.020) | (0.020,0.033,0.100) |
| Diversity and Inclusivity | (0.067,0.089,0.100) | (0.011,0.011,0.033) |
| Healthcare Facilities | (0.067,0.089,0.100) | (0.011,0.011,0.033) |
Step 5: Calculate the distance between each alternative and the fuzzy
positive ideal solution
![]() and the distance between each alternative and the fuzzy negative ideal
solution
and the distance between each alternative and the fuzzy negative ideal
solution
![]()
The distance between each alternative and FPIS and the distance between each alternative and FNIS are respectively calculated as follows:
![]() i=1,2,…,m
i=1,2,…,m
![]() i=1,2,…,m
i=1,2,…,m
d is the distance between two fuzzy numbers , when given two triangular
fuzzy numbers (
![]() ) and (
) and (
![]() ), e distance between the two can be calculated as follows:
), e distance between the two can be calculated as follows:
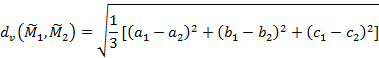
Note that
![]() and
and
![]() are crisp numbers.
are crisp numbers.
The table below shows distance from positive and negative ideal solutions
Distance from positive and negative ideal solutions
| Distance from positive ideal | Distance from negative ideal | |
| Toronto\n - Canada | 0.311 | 0.225 |
| Melbourne - Australia | 0.243 | 0.311 |
| Berlin - Germany | 0.15 | 0.394 |
| Montreal - Canada | 0.311 | 0.229 |
| Amsterda - Netherlands | 0.186 | 0.354 |
| Dubli - Ireland | 0.152 | 0.387 |
| Barcelon - Spain | 0.127 | 0.414 |
| Vancouver - Canada | 0.17 | 0.376 |
| Edinburgh - United Kingdom | 0.227 | 0.314 |
| Singapore | 0.151 | 0.392 |
Step 6: Calculate the closeness coefficient and rank the alternatives
The closeness coefficient of each alternative can be calculated as follows :
![]()
The best alternative is closest to the FPIS and farthest to the FNIS. The closeness coefficient of each alternative and the ranking order of it are shown in the table below.
Closeness coefficient
| Ci | Rank | |
| Toronto\n - Canada | 0.42 | 10 |
| Melbourne - Australia | 0.561 | 8 |
| Berlin - Germany | 0.724 | 2 |
| Montreal - Canada | 0.424 | 9 |
| Amsterda - Netherlands | 0.656 | 6 |
| Dubli - Ireland | 0.718 | 4 |
| Barcelon - Spain | 0.766 | 1 |
| Vancouver - Canada | 0.689 | 5 |
| Edinburgh - United Kingdom | 0.581 | 7 |
| Singapore | 0.722 | 3 |
The following graph shows the closeness coefficient of each alternative.
Closeness coefficient graph